Enter URL
Enter the website URL you want to analyze (e.g. https://example.com).

Full timing breakdown: DNS, TCP, TLS and server processing in milliseconds"Feels slow" is not a measurement, and you cannot fix what you cannot measure. This checker turns that feeling into a number: enter a URL and it measures the full round-trip time to fetch the page, reported in milliseconds.
Full timing breakdown: DNS, TCP, TLS and server processing in milliseconds
Enter the website URL you want to analyze (e.g. https://example.com).
Click "Break Down Response Time" and wait while each phase is timed.
Review the phase bars; the slowest phase is where optimization pays off.
A slow site is a symptom, not a diagnosis: it does not say whether DNS resolution, the TCP handshake, TLS negotiation, or the application itself is eating the milliseconds. This checker times each network phase separately, reporting honest millisecond numbers for DNS lookup, TCP connect, TLS handshake, and server processing, with the slowest phase highlighted.
Before-and-after proof.
Enabled page caching and want to see the difference in hard numbers.
Moved to a faster host or turned on a CDN and need the improvement quantified.
Debugging a slowdown that started Tuesday and need to know whether it is really slower or just feels that way.
The checker becomes the scoreboard for each fix you ship, measured before and after every change.
Single measurements lie.
Networks fluctuate and caches warm up; look at the pattern rather than any one reading.
Under 200 milliseconds feels instant; 200 to 500 is ordinary; past a full second, something deserves investigation.
Uncached dynamic pages, slow database queries, and distant hosting line up in order when the number is too high.
Live round-trip measurements from an external server. Run before and after each optimization.
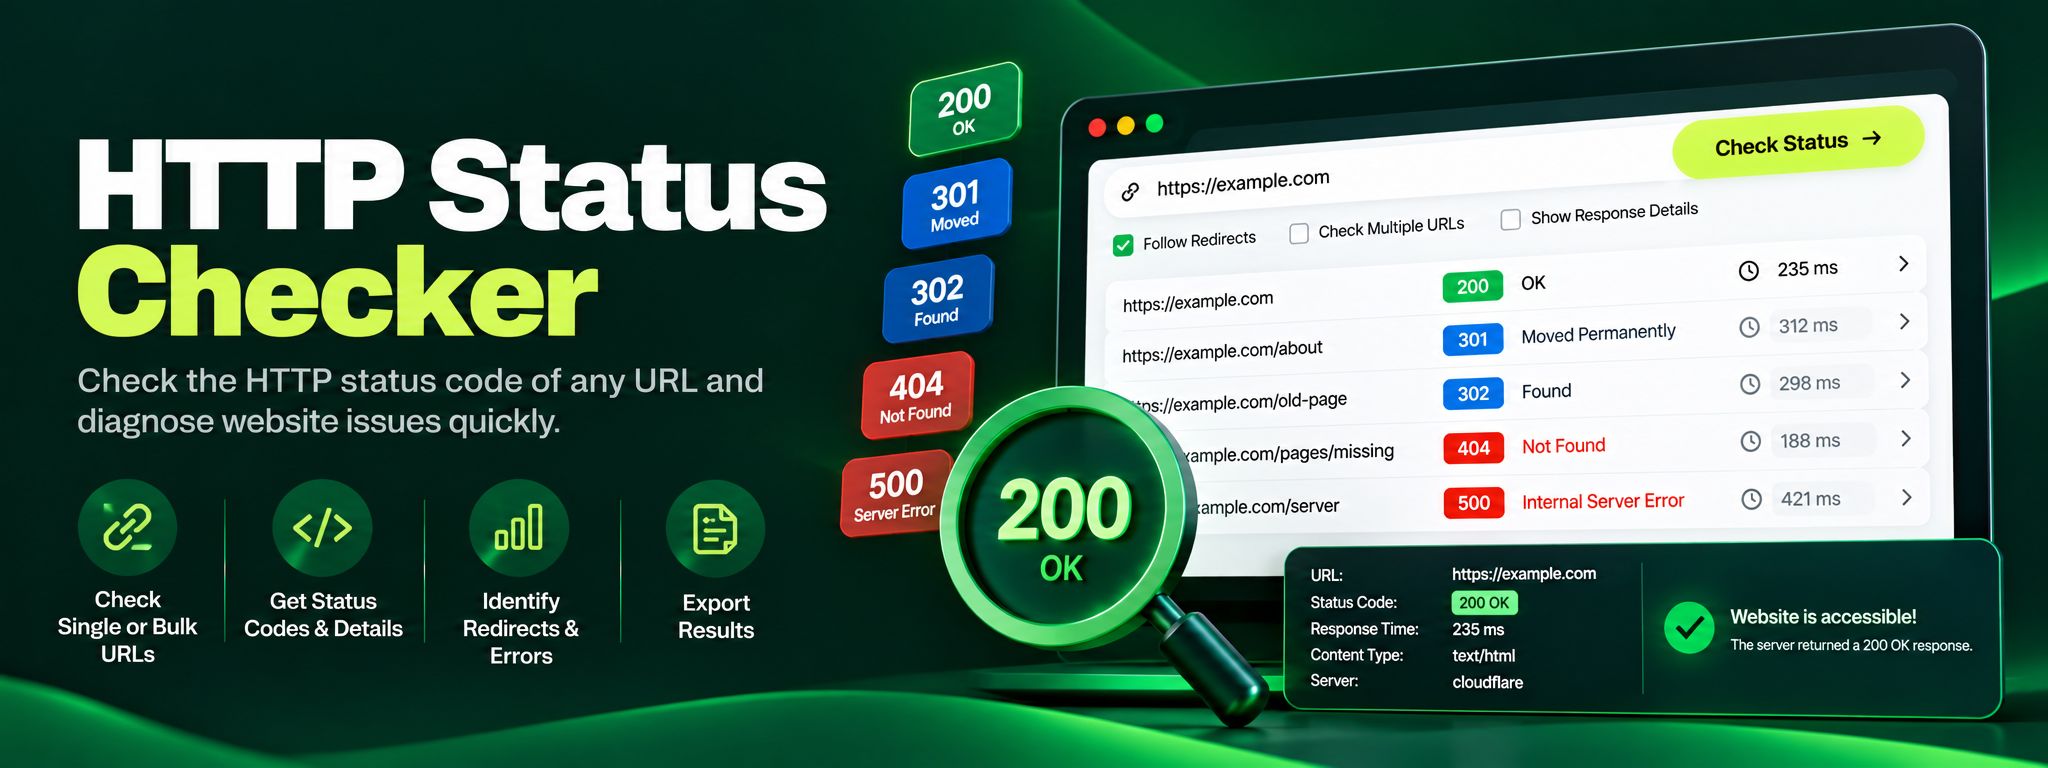
Free HTTP status checker. Check any URL's status code, trace redirect chains hop by hop, and fix 404, 301 and 500 errors before they silently hurt your SEO.
Read article →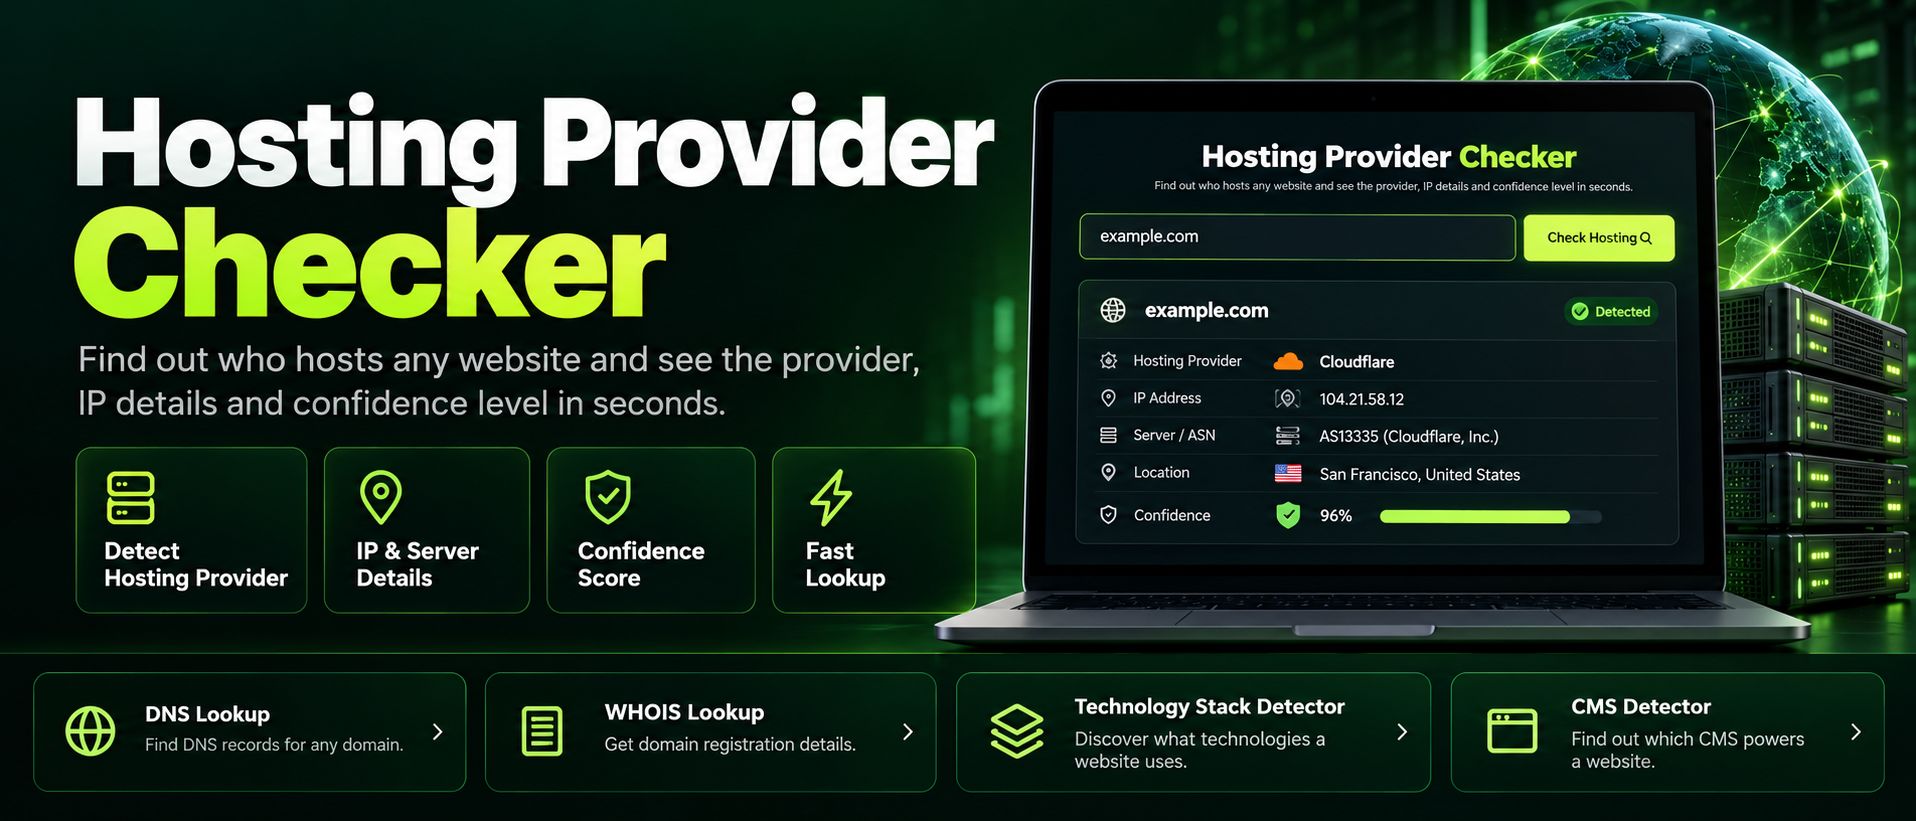
Free hosting provider checker. Reveal any website's hosting company accurately, server IP and reverse DNS from header and DNS fingerprints, in seconds.
Read article →